(ESMA, 2024)
from a legitimate service
signal must include
intraday signals
You see a signal pop up on Telegram. EURUSD. Buy. Entry 1.0850.
Do you take it? Do you know why it was generated? Do you know what happens if it’s wrong?
Most traders who follow day trading signals can’t answer those three questions. They follow the signal, hope for the best, and then wonder why they keep losing even when signals look clean on the surface.
A day trading signal is only as useful as your understanding of what generated it. A signal without context is just noise with an entry price attached.
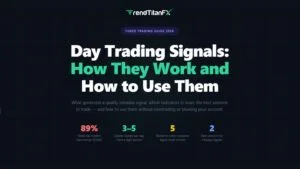
This guide covers exactly what day trading signals are, how the best ones are generated, which indicators power them, what a complete intraday signal looks like, and how to find a signal service worth following in 2026.
| 📋 What you’ll learn → What a day trading signal is — the direct one-sentence definition → The 5 indicators that generate the most reliable intraday signals → What separates a complete signal from an incomplete one → The best sessions for following intraday signals → How to use day trading signals without overtrading or blowing your account |
What Is a Day Trading Signal?
A day trading signal is a real-time alert that tells a trader when to enter or exit a trade within a single session, based on technical analysis, price action, or a combination of both. Unlike swing trading signals which play out over days, intraday signals are time-sensitive — they need to be acted on quickly or the entry is missed.
A complete day trading signal includes five elements. Miss any one and you’re trading blind:
| Element | What It Should Show | Red Flag |
|---|---|---|
| Instrument | Specific pair — EURUSD, XAUUSD, GBPUSD | Vague (“a major pair”) |
| Direction | BUY or SELL — unambiguous | “Watch for potential buy” |
| Entry price | Specific level — e.g. 1.0850 | “Enter at market” with no level |
| Stop loss | Exact level — no exceptions | Missing entirely |
| Take profit | At least one defined target | “We’ll update later” |
A signal missing the stop loss is not a signal. It’s a direction with no defined risk. Never take an intraday alert that doesn’t include all five elements — regardless of how good the provider’s track record looks.
What Generates Day Trading Signals?
Day trading signals are generated in three ways: by human technical analysts, by automated algorithms reading indicators, or by a combination of both. Understanding which type you’re following matters because each has different strengths and failure points.
Human analyst signals — Generated by an experienced trader reading price action, key levels, and market structure. The strength is contextual judgment — a human can see that a level looks technically valid but hold the signal because high-impact news is 20 minutes away. The weakness is speed. Intraday markets move fast and human analysis takes time.
Algorithmic signals — Generated automatically when a set of indicator conditions are met. The strength is speed and consistency — the algorithm never has a bad day emotionally. The weakness is that algorithms can’t account for context. An algorithm doesn’t know the Bank of England is speaking in 10 minutes.
Hybrid signals — The most reliable type. An algorithm flags the setup, a human analyst confirms it before publishing. This is what professional signal services use. At TrendTitanFX, every Forex VIP signal goes through analyst review before it’s published — which is why entry prices are consistently reachable when signals are posted, not already moved past.
The 5 Indicators That Generate the Best Day Trading Signals
The most reliable day trading signals come from combining one trend indicator, one momentum indicator, and one volatility indicator. Using more than three creates conflicting data and analysis paralysis. According to research published in 2026, combining complementary indicators — rather than stacking multiple similar tools — produces the most consistent signal accuracy across varying market conditions.
1. EMA (Exponential Moving Average) — The Trend Filter
An Exponential Moving Average is a trend-following indicator that gives more weight to recent price data, making it faster to react to price changes than a standard moving average.
For intraday trading, the most effective setup is plotting a 5-EMA and 20-EMA on a 15-minute chart. When the 5-EMA crosses above the 20-EMA with both lines above a 50-EMA — that’s a buy signal. The reverse generates a sell. EMAs are lagging indicators — they confirm a trend that has already started, not predict one.
Best for: Confirming trade direction. Never enter against the EMA direction on intraday trades.
2. RSI (Relative Strength Index) — The Momentum Gauge
RSI is a momentum oscillator that measures the speed and magnitude of price movements on a scale of 0–100, signalling overbought conditions above 70 and oversold conditions below 30.
For day trading, RSI works best in ranging markets to identify potential reversal points. In strong trending markets, RSI can stay above 70 or below 30 for extended periods — which is why experienced traders watch for RSI divergence. If price makes a new high but RSI makes a lower high — that’s bearish divergence and a high-probability sell signal.
Best for: Confirming entry timing once direction is established by the EMA.
3. MACD — Trend and Momentum Confirmation
MACD (Moving Average Convergence Divergence) is a trend-following momentum indicator that generates signals when its fast EMA line crosses the signal line.
For intraday use, standard settings (12, 26, 9) can be slow. Professional day traders often use faster settings — 5-13-5 or 3-10-16 — to capture quicker price movements. A bullish signal occurs when the MACD line crosses above the signal line. A bearish signal occurs on the cross below. The histogram shows momentum strength — wider bars mean stronger momentum behind the move.
Best for: Confirming momentum behind a setup already identified by EMA and RSI.
4. Bollinger Bands — The Volatility Reader
Bollinger Bands consist of a 20-period moving average with two bands plotted two standard deviations above and below it — expanding in high volatility and contracting in low volatility.
When the bands contract (a squeeze), it signals a significant price move is coming. When price breaks outside the bands with RSI confirmation, it signals a high-probability breakout entry. According to a 2025 study analysing nearly a century of Dow Jones data, Bollinger Bands ranked among the most consistent indicators for signal reliability across all market conditions tested.
Best for: Identifying breakout setups and high-volatility entry points.
5. VWAP (Volume Weighted Average Price) — The Institutional Level
VWAP is the average price an instrument has traded at throughout the day, weighted by volume — making it the key reference level used by institutional traders and algorithms.
For retail day traders, VWAP is critical because it shows where institutional money is positioned. Price above VWAP means buyers are in control. Price below means sellers dominate. Many professional signal providers only publish long signals when price is above VWAP and short signals when price is below — this simple filter removes a significant percentage of false signals.
Best for: Filtering signal direction against institutional bias.
| 💡 PRO TIP The most reliable intraday signals come from confluence — when EMA direction, RSI momentum, and VWAP bias all align in the same direction. One indicator giving a signal is a possibility. Three indicators agreeing is a high-probability setup worth acting on. |
The Best Sessions for Day Trading Signals
The best day trading signals are generated during the London session (8am–12pm GMT) and the New York session (1pm–5pm GMT) — particularly during the London-New York overlap (1pm–4pm GMT). This window has the highest volume, tightest spreads, and most reliable price action of any period in the trading week.
| Session | Time (GMT) | Spread Quality | Signal Reliability |
|---|---|---|---|
| Asian session | 12am–8am | Wide | Lower — thin volume, choppy |
| London session | 8am–12pm | Tight | High — highest forex volume globally |
| NY overlap | 1pm–4pm | Tightest | Highest — both markets active simultaneously |
| NY close | 4pm–5pm | Widening | Medium — momentum can fade |
A signal posted at 3am during the Asian session on EURUSD should make you more cautious — not because the setup can’t work, but because thin volume increases the chance of price spiking through your stop loss on a spread widening event. The TrendTitanFX Forex VIP channel posts intraday signals during the London and New York sessions specifically — not randomly throughout the 24-hour cycle.
How to Use Day Trading Signals Without Blowing Your Account
Getting the signal is the easy part. Applying it correctly is where most traders go wrong.
Rule 1: Size the position correctly before you enter
Never enter a day trading signal without calculating your position size first. The signal gives you the entry and stop loss. Your job is to calculate how many lots to trade so that if the stop loss is hit, you lose no more than 1–2% of your account.
Use the TrendTitanFX Lot Calculator before every single intraday trade. On XAUUSD, a 50-pip stop with a 0.1 lot risks $50. On EURUSD, the same lot size and stop risks $5. The difference matters enormously when you’re taking multiple signals per session.
Rule 2: Set a maximum number of trades per session
Intraday overtrading is the single biggest account-killer for signal followers. A legitimate day trading signal service sends 3–5 quality setups per day. If you’re taking 15 trades a day, you’re not following signals — you’re gambling with them.
Set a hard limit before the session opens: maximum 3 signals per day. If all three are stopped out, the session is over. No revenge trades. No “one more setup.”
Rule 3: Check the economic calendar before every entry
Always check the economic calendar before taking any intraday signal. If EURUSD is 15 minutes from a high-impact NFP, CPI, or FOMC release — wait. Even a perfect technical setup can be wiped out by a 100-pip news spike in seconds. Make this a habit on every trade regardless of whether the signal provider flags it.
| ⚠️ Warning If a day trading signal service never mentions news events or session timing — that’s a red flag. Professional analysts know context matters as much as the technical setup. A signal without market context is guesswork dressed up as analysis. |
What to Look For in a Legitimate Day Trading Signal Service
A legitimate intraday signal service posts signals before the move, includes all five elements on every alert, and acknowledges stopped-out trades publicly. Use this checklist on any channel before you follow a single signal with real money:
| What to Check | Legitimate Channel | Fake Channel |
|---|---|---|
| Signal timing | Posted before the move | Posted after entry already passed |
| Stop loss | Every alert, no exceptions | Missing or “use your discretion” |
| Losing trades | Acknowledged publicly | Deleted or ignored |
| Win rate claimed | 60–75% realistic range | 90%+ with no verification |
| Performance proof | Myfxbook, FXBlue, or public page | Screenshots only |
| Session awareness | London and NY sessions noted | Signals at all hours, no context |
The TrendTitanFX signal performance page publishes results openly — wins and losses — because transparency is the baseline requirement for any provider asking you to follow their analysis with real money.
| Want structured intraday signals during London and New York sessions? TrendTitanFX Forex VIP delivers 3–5 analyst-reviewed signals daily — with entry, stop loss, and take profit on every alert. → Forex VIP Signals → Lot Calculator → Signal Performance |
FAQ — Day Trading Signals
A day trading signal is a real-time alert that tells a trader when to enter or exit a trade within a single session, based on technical analysis or price action. A complete intraday signal includes the instrument, direction (buy or sell), entry price, stop loss, and at least one take profit level. Any signal missing the stop loss is incomplete and should not be followed.
The most reliable day trading signals use a combination of a trend indicator (EMA), a momentum indicator (RSI or MACD), and a volatility indicator (Bollinger Bands). According to 2025–2026 studies including analysis of nearly a century of market data, no single indicator outperforms consistently — confluence between 2–3 complementary indicators generates the highest-probability setups.
The best time to follow intraday signals is during the London session (8am–12pm GMT) and the New York session (1pm–5pm GMT), particularly during the London-New York overlap (1pm–4pm GMT). This window has the highest volume, tightest spreads, and most reliable price action of any period in the trading week.
Some are, most aren’t. Reliable day trading signal channels post all five signal elements on every alert, show losing trades alongside winning ones, and have independently verifiable performance data through Myfxbook or FXBlue. Channels that only post winning trades or post signals after the move has already happened are not generating real-time signals.
A maximum of 3 quality signals per session is a sensible limit for most retail traders. Professional signal services send 3–5 high-quality intraday setups per day. Following more than that typically leads to overtrading, conflicting positions, and emotional decision-making — all of which damage account performance regardless of signal quality.
A day trading signal is designed to be entered and exited within the same session — typically targeting 30–100 pips with tighter stop losses. A swing trading signal holds positions for hours to days, targeting larger moves of 50–200+ pips with wider stops. Day trading signals require more screen time and faster execution. Swing signals suit part-time traders who cannot watch screens throughout the session.
Never enter a signal without first calculating your lot size using a position sizing tool. Risk no more than 1–2% of your account per trade. Set a maximum of 3 trades per session. Stop trading if you hit your daily loss limit. Always check the economic calendar before every entry to avoid trading into high-impact news events like NFP, CPI, or FOMC releases.